Observability
Full visibility into every task run: execution traces, preserved inputs and outputs, logs, metrics, and alerting.
Every run, fully traced
Every task run in Hatchet is queryable through an API and a web UI. Each task provides a full execution trace, preserved input and output data, and associated logs.
Every run exposes inputs, outputs, retries, traces, and logs, all from the API and dashboard.
OpenTelemetry-native
Hatchet’s built-in OpenTelemetry collector provides a complete set of traces and spans for every task and workflow execution. You can also forward traces to your preferred observability stack: Datadog, Grafana, Honeycomb, or any OTEL-compatible backend.
Forward your traces to your preferred OpenTelemetry provider, or use Hatchet’s built-in collector.
Task & workflow monitoring
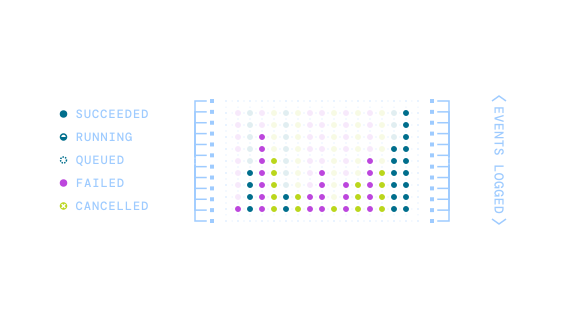
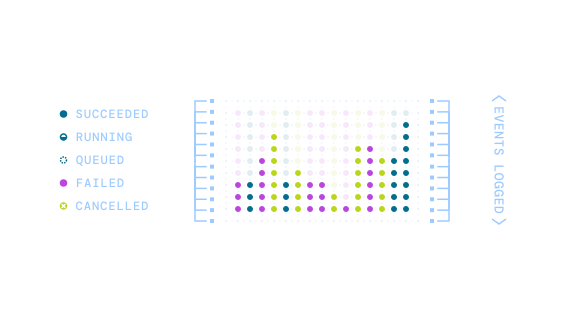
Get a complete picture of every workflow, task, and event in your system. Status updates and metrics are real-time and searchable for easy debugging. Use Hatchet as a centralized platform for observability, monitoring, and alerting.
Contextual logging
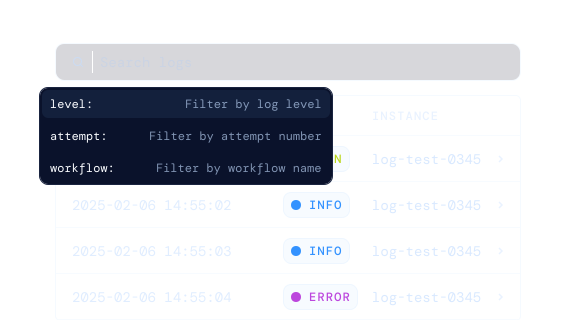
Send application logs directly to Hatchet, with support for full-text search and complex filtering. Logs are attached to the task run that produced them, so you never have to cross-reference timestamps across systems.
See everything your tasks are doing. Build self-improving systems with full context.
Start for free — no credit card required
Processing over 100 million tasks/day on Hatchet Cloud
Open-source and self-hostable