The pitfalls of partitioning Postgres yourself
(not a hatchet job on Postgres partitioning - we do actually like it)

If you dive deep into Hatchet’s codebase these days, you might get the impression that we don’t know what we’re doing. In particular, for a seasoned Postgres user, this method might stand out to you:
This method goes through a handful of our Postgres tables and runs ANALYZE <table_name>; , seemingly at random.
Yes, we do have autovacuum enabled on our databases (and we expect users who are self-hosting to have it enabled as well), which means that tables are autoanalyzed after they get autovacuumed. Why are we manually running analyze on our tables all the time?
While there are a bunch of ways in which we don’t know what we’re doing, this particular bit of code comes from a hard-won set of production incidents, and some nuances of Postgres’s autoanalyze implementation.
Why partition?
For some background, Hatchet is a durable queue, built on top of Postgres, which offers useful features for running complex background jobs, like workflows and durable execution. As a result, we store up to hundreds of millions of tasks per day inside of a set of Postgres tables. In the first version of Hatchet, we used to assign each task a UUID and store runs in a single table. This worked well, until we hit ~200 million rows and started to see our indexes and tables bloat.
Even worse was deleting old tasks to keep storage costs down; we had to run a chunked deletion process almost 24/7, and because of various foreign keys and constraints, this wasn’t always fast enough to keep up with the ever-growing size of the Postgres table.
So we started looking into time-based partitioning of our tables. For those unaware, Postgres has built-in support for partitioning, including range-based and hash-based partitioning.
We also explored a few extensions, like pg_partman and TimescaleDB, but Hatchet is open-source, and we wanted to make it possible to deploy Hatchet to any Postgres provider without requiring managing an extension.
We decided to roll our own partitioning system.
Building our partitioning system
It’s surprisingly simple to do your own partitioning with Postgres. The most difficult part—or so we thought—is managing the partitions and (in our case) making sure they get properly detached and deleted after a certain retention window.
We partition only a handful of tables that would otherwise have billions of rows. We’re going to focus on two tables, v1_task (the table which holds our task data), and v1_task_event, which stores an event history per task (like completion events). Here’s a simplified schema:
Our partitions are daily and rolling, so we can’t just declare the partitions in the schema during a migration. We therefore have an application-side process which is responsible for:
- Creating new partitions ahead of time (with a 2-day lead time, so we have plenty of time to respond in case a partition doesn’t get created).
- Dropping old partitions after the retention window. To avoid locking the parent partition table for longer than necessary, we utilize
DETACH PARTITION...CONCURRENTLYfollowed byDROP TABLE.
This last trick of using CONCURRENTLY avoids taking out as restrictive of a lock on the parent table, but risks an orphaned detach process which must be finalized if it fails.
The rollout of our new partitioning system initially went without a hitch. We had bundled this into our Hatchet v1 migration (essentially a rewrite of the entire Hatchet backend), and had run a bunch of load tests against the new system to make sure that our partitioning held up under load.
The incident
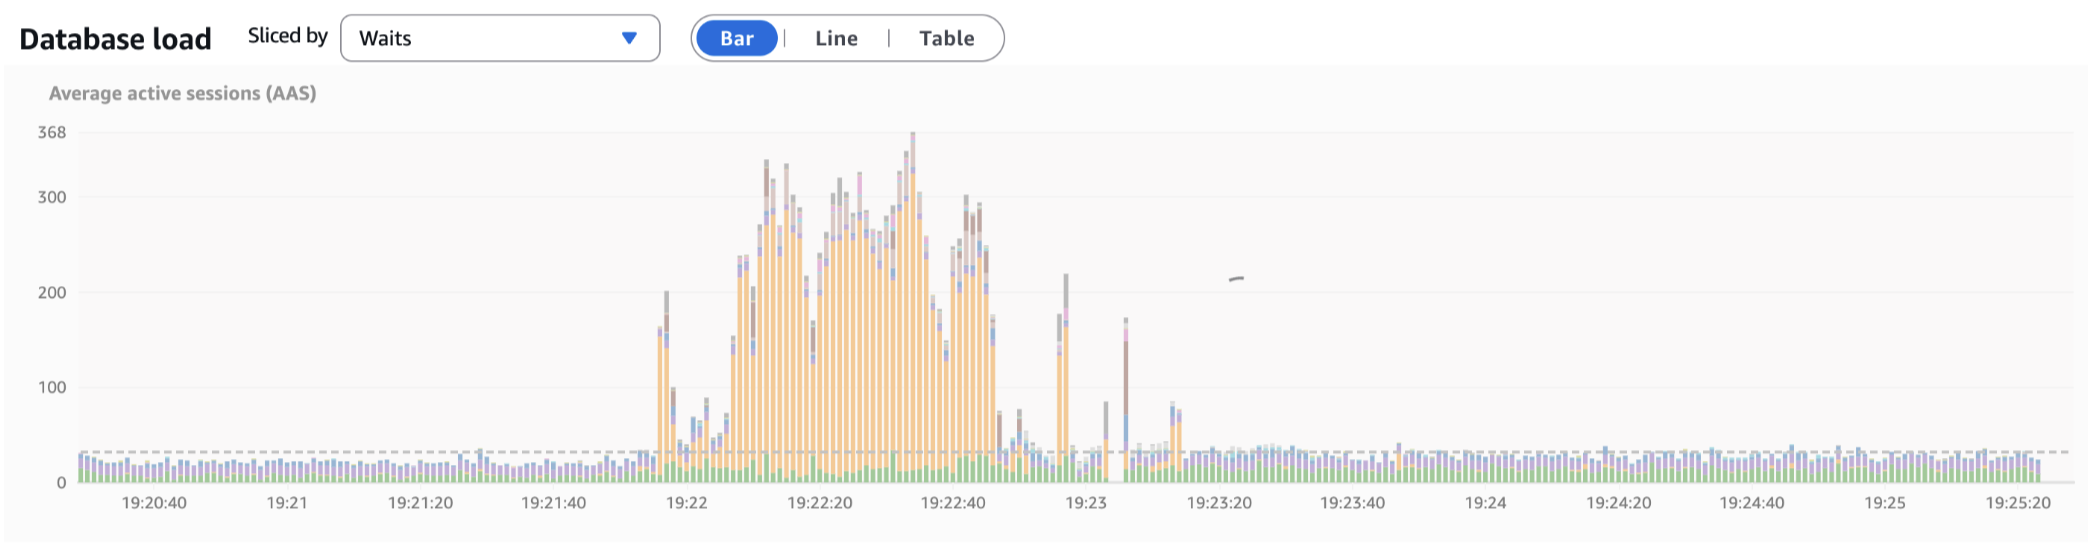
For a few days, everything was great, until we noticed some queries getting slower. This trend continued for the next few days, with some queries on the partitioned tables taking up to 10× longer than they should, from just a few milliseconds to >20 milliseconds. This resulted in massive spikes of active sessions and CPU when under even moderate amounts of load:
We noticed that the slow queries had two things in common:
- They all involved a partitioned query in a
JOINstatement somewhere. - They selected many rows using a compound primary key. Our partitioned tables all have compound primary keys and we do a lot of batched reads and writes.
At first, we suspected that we simply had too many partitions that were being scanned, and there was some type of shared lock which was preventing or slowing index scans on each table. To test this hypothesis, we tried to get the Postgres query planner to prune partitions in the planning phase. But this didn’t help.
We next tried to reproduce the issue locally. This proved rather difficult, because the volume of data that we stored in these tables wasn’t easy to deal with locally. But we were fortunately able to come up with a rather trivial example which illustrated the query discrepancy.
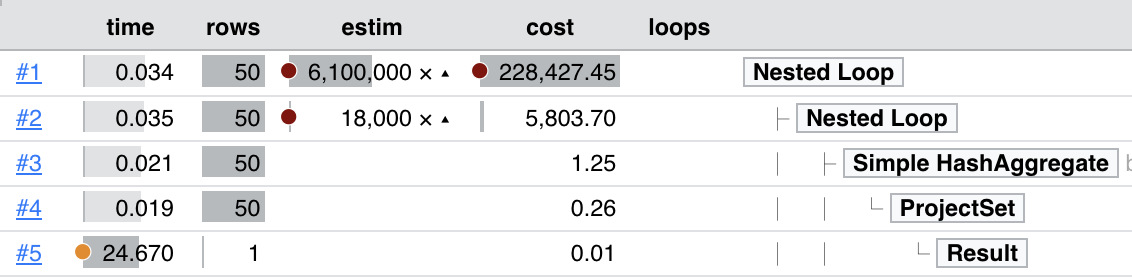
After creating 14 days worth of partitions, each with 1 million rows in them, we ran an EXPLAIN ANALYZE on a query quite similar to the following:
This resulted in the following query plan: https://explain.dalibo.com/plan/fa91509f3bfh84e8 . Most notably, the row estimate is off by a factor of 6100000×!
Why row estimates matter
Postgres has a built-in tool called the query planner to pick the optimal query strategy. This query planner uses statistics on the target table to figure out whether or not to use an index, which type of merge strategy to use on joins, etc.
If the query planner doesn’t have correct statistics, it can create wildly suboptimal query plans, such as deciding to do a sequential scan across an entire table instead of an index-only scan. If you expect a query which filters specifically by a primary key to take a few milliseconds, but instead that query starts doing a different type of scan taking tens or hundreds of milliseconds, it can build up database pressure incredibly quickly.
The process responsible for maintaining query statistics is ANALYZE . We tune autovacuum settings quite carefully on our databases, ensuring that all high-throughput tables are autovacuumed very frequently and that we don’t have backlogs on autovacuum processes.
So why were our query statistics off?
The solution
At this point, we were quite stumped, so we called in an expert: Laurenz Albe. After going through our repro, Laurenz made the suggestion to run ANALYZE on the parent table manually. We were a little skeptical, but we ran it anyway—and this immediately fixed our problems.
It turns out that we missed a little footnote in the Postgres docs:
Partitioned tables do not directly store tuples and consequently are not processed by autovacuum. (Autovacuum does process table partitions just like other tables.) Unfortunately, this means that autovacuum does not run ANALYZE on partitioned tables, and this can cause suboptimal plans for queries that reference partitioned table statistics. You can work around this problem by manually running ANALYZE on partitioned tables when they are first populated, and again whenever the distribution of data in their partitions changes significantly.
We put up a PR, and all of our rollout issues were resolved.
As an aside: why didn’t our load tests catch this? Unfortunately, our “hot-path” from when a task is queued to when it’s executed very rarely involves large JOINs on the partitioned tables, and this was the bulk of our focus for the load testing. We also didn’t populate many days worth of partitions in our load tests, opting instead to push a single partition to its limit, so perhaps the query planner was able to make better estimates with fewer partitions.
Tips on partitioning
We learned a few things that were rather non-obvious from partitioning tables ourselves—primarily:
- Use
DETACH PARTITION...CONCURRENTLYto reduce lock contention on the parent partition table when removing old partitions - Use
DETACH PARTITION...FINALIZEto clean up orphaned partitions, sinceCONCURRENTLYisn’t transactional. - Run
ANALYZEevery once in a while on your parent partition tables (and ensure that autovacuum is running for the child partitions)
We are very grateful to Laurenz for helping us debug this issue! For more reading, there’s also a post on the Cybertec blog about this.