The fastest Postgres inserts
How to speed up your Postgres insert performance.

At Hatchet, we spent the past half year running hundreds of benchmarks against different Postgres configurations. We set out with a simple question: at what scale does Postgres break?
For us, the question is existential—we use Postgres as the backing database for our task queue, orchestrator, and monitoring system.
We had good reasons for building on top of Postgres, which we’ve written about elsewhere. But after starting to scale the system, we’d been observing some concerning behavior on our database—very high spikes in CPU, esoteric errors like multixact members limit exceeded, high lock contention—and we weren’t sure whether we’d reached some universal limit in our Postgres cluster, or whether we were doing something wrong.
It turns out, after some simple tweaks, we saw a major performance boost. And with some non-simple tweaks, we squeezed much more performance out of Postgres than we expected.
If you’re used to interacting with Postgres from the client side, perhaps you’re having a similar (probably less existential) crisis. Given the wide array of specialized data stores out there—Kafka, Valkey, Clickhouse, countless others—and thousands of infrastructure consultants whose sole purpose is to convince you to switch to a difficult-to-manage managed service, there’s generally a lack of intuition for how far a database like Postgres can scale on modern hardware.
Here’s attempt to make things more concrete, at least on the write side of Postgres.
The basics
Note: you might want to skip to the next section if you’re familiar with connection pooling and the danger of using too many connections.
Let’s start simple: we’d like to insert some data into Postgres. Out of a force of habit, I’m going to call the table we’re interacting with tasks—this is a very simple table that contains an ID, a created_at timestamp, and a JSONB payload to represent arbitrary data:
Here’s how an insert might look:
Let’s try inserting 100k records into our table. For this, we’ll use a single database connection and just loop until each record has been inserted. How long does this take? Using my benchmarking tool written in Go (whose code can be found here), I get the following data on my local machine (Postgres in Docker on a Macbook Pro M3 Max chip):
Not bad—on a single connection running queries with virtually no network latency, we can get up to ~2k writes/second.
(Side note—I’d typically use pg_bench but we’re going to add in some application-side buffers in a moment, and wanted testing to be consistent with the buffered benchmarks as well as our built-in connection manager pgxpool)
What happens if we introduce network latency? Throughput is going to be impacted very significantly—by adding an artificial 2ms of latency, which might be expected if you’re connecting to a managed database in the same region but not the same cloud provider, this will drop to about 400 rows/second!
Optimization #1: reduce network latency (if possible)
You may have also noticed that we ran this on a single connection. Naturally we’d like to increase the number of parallel writes, which brings us to the second optimization: connection pooling. If you’re unfamiliar, this is basically the practice of re-using a group of long-lived session-level connections for queries. So instead of running queries one at a time in a loop, we’ll write rows using all of the connections available in the pool. How fast can we write data on 10 connections at once?
So by using all 10 connections in the pool, we’re able to get 5× the amount of throughput!
Optimization #2: use a connection pool
Amazing, let’s increase connections even more! We’re basically printing money!
… but not so fast.
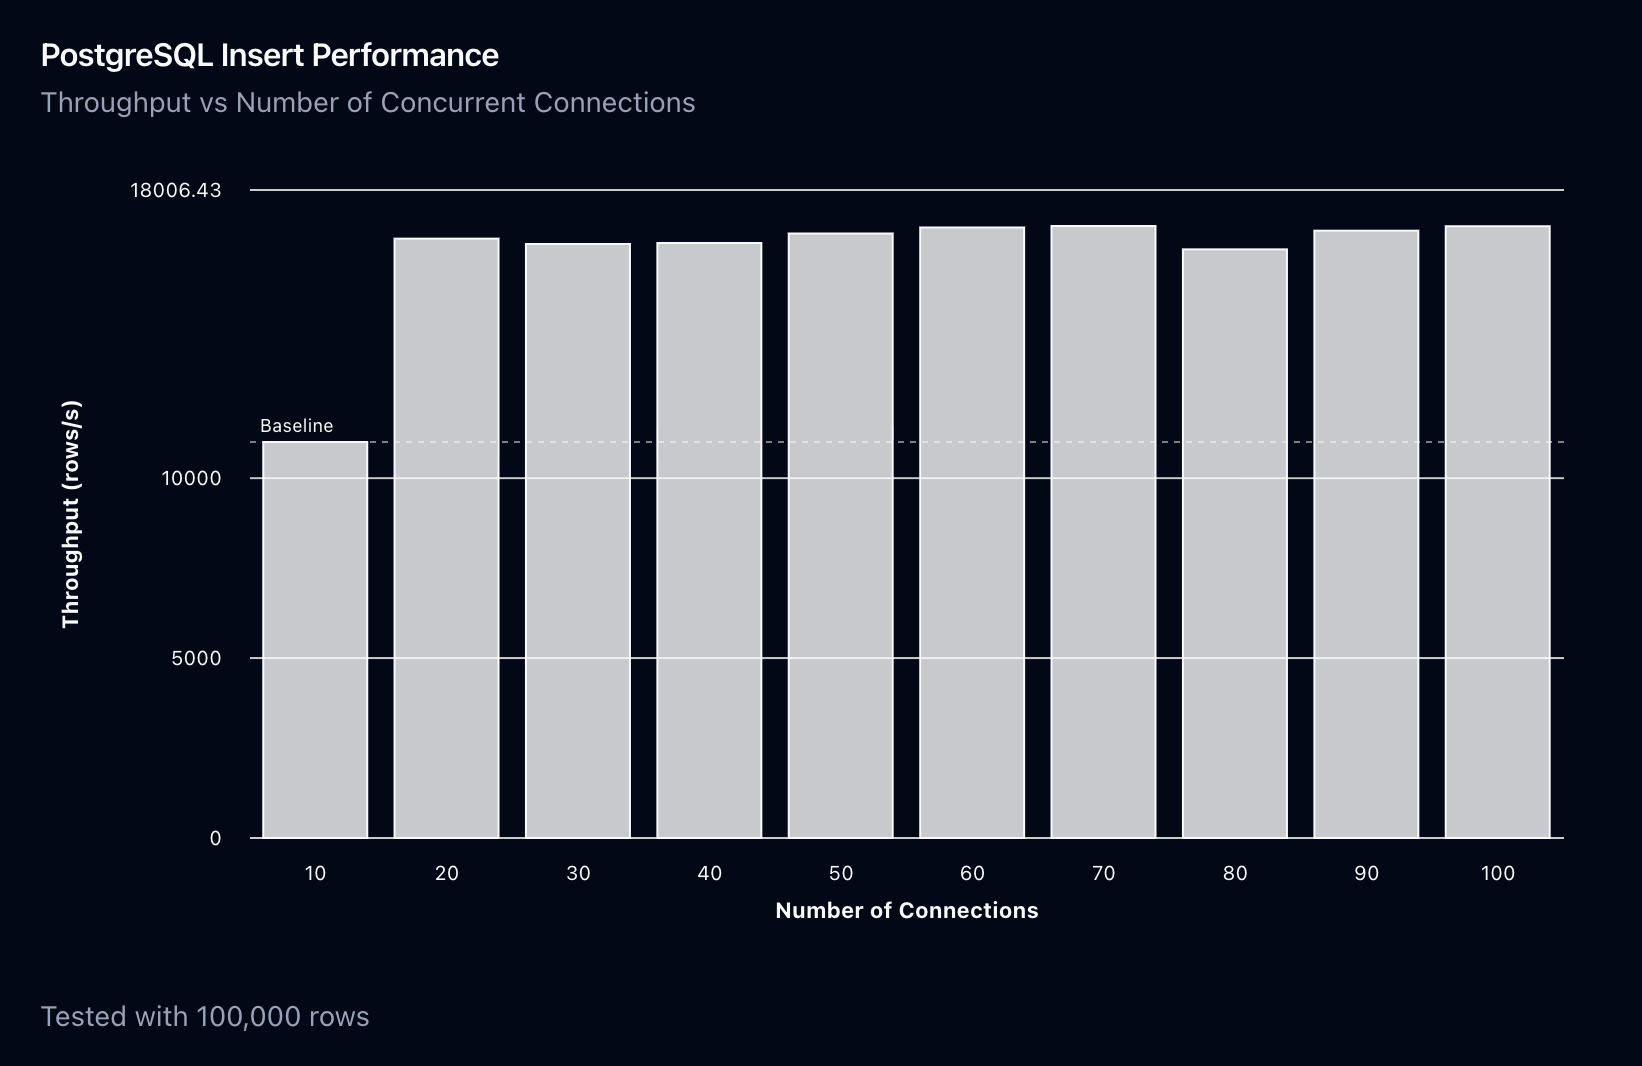
You may have noticed that despite having 10× the amount of connections, we only have 5× the throughput. Let’s try doubling the connections again, to 20 connections:
Hmm, our average write times are going up, and our throughput is only 50% higher. Let’s try doubling one more time, to 40 connections:
Our throughput when using 40 connections is actually slightly lower than when using 20 connections, and our average write latencies have increased!
What’s going on? Each connection in Postgres doesn’t come for free—there’s overhead introduced in multiple places:
- There’s overhead at the application level to acquiring a connection from the pool
- With multiple writers, there’s some overhead involved in both CPU and shared resources like buffers and locks, as well as other bottlenecks like parallel disk i/o. At a certain point, the overhead of each connection will exceed the performance gain of using more connections.
- If we’re saturating CPU, this will introduce dampening behavior, making it slower to acquire locks and for Postgres to spawn a query process, which can increase the average write time and thus slowing throughput.
On my local machine, we saturate the usefulness of more connections at around 20 connections:
Which brings us to optimization number three:
Optimization #3: don’t use too many connections.
We’ve seen quite a few databases where connection limits are set to an incredibly high number, which can cause more harm than good, particularly if you trigger a “connection storm” (a sudden spike in connections), which can cause the database to saturate its lightweight lock manager and cause extremely slow write times.
What’s the right size of the connection pool? This will vary from database to database—see here for a guide on right-sizing your connection pool.
So, let’s recap the basics:
- Reduce network latency
- Use a connection pool
- Don’t use too many connections
Batched inserts
We got to 12k writes/s on my local instance—can we push it further? Not only is there overhead involved in each connection, but there’s also overhead involved in each query: this includes the round-trip time to the database, the time it takes the internal application connection pool to acquire a connection, and the time it takes Postgres to process the query (including a set of internal Postgres locks which can be bottlenecks in high-throughput scenarios).
To reduce this overhead, we can pack a batch of rows into each query. The simplest way to do this is to send all queries to the Postgres server at once in an implicit transaction (in Go, we can use pgx to execute a SendBatch )
What does performance look like when we use a batched insert for 100k rows instead of inserting rows 1 at a time (on a single connection)?
If we compare this to the single-connection inserts from before, we see a >10× improvement in throughput. But one thing that may not be immediately obvious is how to implement batched inserts in your application.
The way that we tackled this in Hatchet is to add a set of very lightweight, in-memory buffers which flush an array of tasks to the database with the following properties:
- The buffer has reached its flush interval , or
- If the buffer has reached its maximum size , it blocks writes until the buffer has been flushed, to properly exert backpressure on the application.
To test this, let’s tweak our testing methodology slightly. Instead of writing 100k rows at a time, let’s continuously generate data as quickly as possible, and write it to the database as quickly as possible (a more realistic test for an OLTP workload). In this test, we’ll use a set of 20 buffers to take advantage of connection pooling with a max size per buffer of 100 rows—in Postgres semantics, each buffer utilizes 1 connection at a time, and we can write 100 rows per transaction. How does this perform?
We’ve gone from 2k writes/s → 80k writes/s without doing much work! (we’ll discuss the increased latency in a moment).
Optimization #4: use batched inserts
COPY
Can we push this further? There are a few more things we can do on the query side to increase throughput. Notably, if you only care about writing data and you don’t need rows to be returned to the application, you can use COPY to get even better performance. Let’s try a single batch of 100k rows using COPY...FROM:
So our throughput has increased to 63k writes/s, up from 2k writes/s when looping over a single connection, and 37k writes/s sending a batch of inserts with a single query.
Why is COPY...FROM so much faster? I won’t go into the full details here, but my understanding is that Postgres has several optimizations when performing a COPY related to the usage of shared resources like buffers and locks. For more information there’s a great writeup here.
Let’s continuously generate data again, and see how this compares to our batched inserts from before. Can we beat 80k writes/s?
So, we can perform 92k writes/s, which is a 31× improvement from our original, naive implementation, and our average write latency is down as well, from ~43ms to ~18ms.
Optimization #5: use COPY…FROM where appropriate.
Optimizing Latency
Unfortunately, there’s no free lunch. Although our throughput is much, much higher, our average write latency has gone from < 1ms to 17ms in the buffered COPY...FROM case.
These are inherently opposed forces: to increase throughput, we need to reduce the impact of shared resources (on the database, this is primarily locks, processes and i/o). To do this, we have to pack more data into a single query, which means that our writes will inherently be slower.
But we don’t have to sacrifice this much latency in order to increase throughput. At a certain point, increasing the batch size will not yield any additional throughput, because the time spent on i/o when writing the data to disk will far exceed the overhead of each connection and query. To illustrate this, let’s look at throughput and latency as a function of batch size and flush intervals:
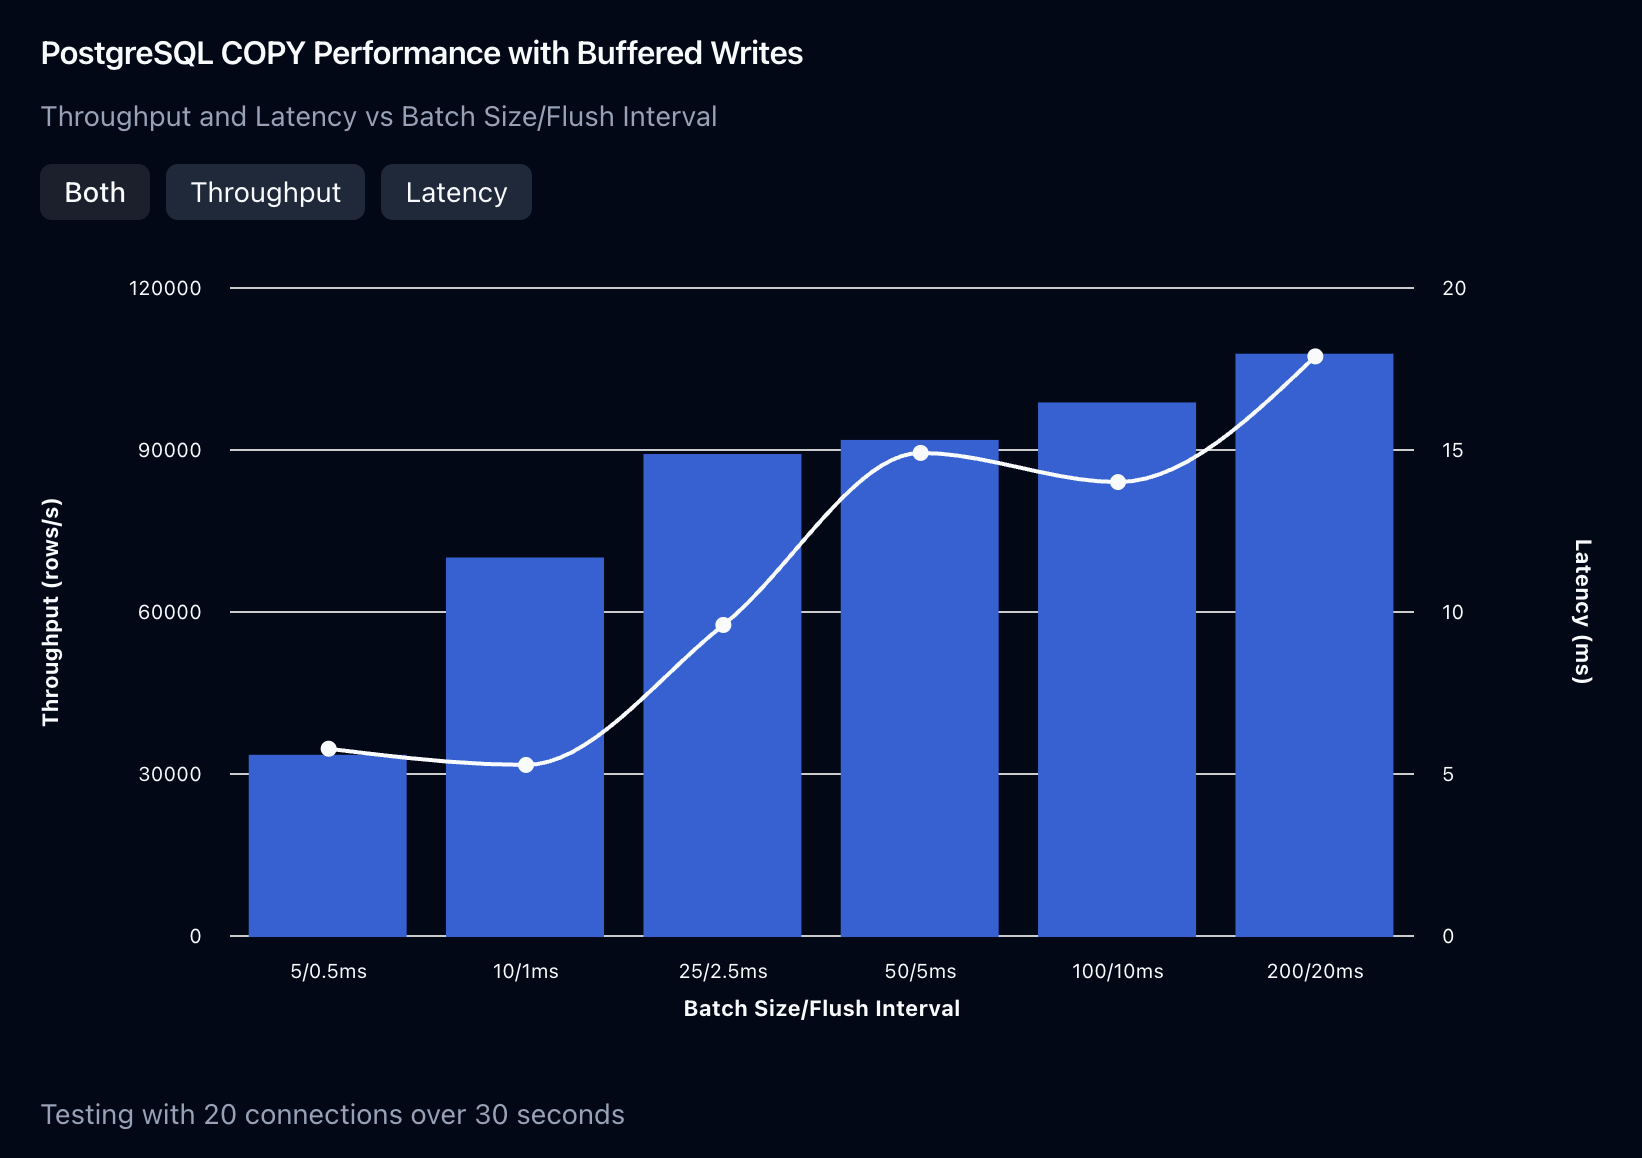
You’ll see from the graph above that even an average batch size of 25 rows nearly saturated the throughput we could achieve on the database, with only a latency overhead of ~10ms. Which brings us to the final optimization:
Optimization #6: determine the batch size which optimizes throughput and latency for your inserts, and don’t waste unnecessary time on flushing batches which are too large.
As an aside, you might be wondering why the latency is sometimes lower when batch sizes/flush intervals are increased. We’ve set up the buffers to not flush more than their flush interval allows, which means that the buffer is at capacity before the flush interval, it may have to wait before it can flush data. The ideal buffer hits its flush interval exactly when it reaches its maximum size, so there’s some additional tuning we could do with the flush interval.
To recap
We made 6 optimizations to increase our throughput while keeping latency low:
- Reduce network latency
- Use a connection pool
- Don’t use too many connections
- Use batched inserts
- Use
COPY...FROMwhere appropriate - Determine the batch size which optimizes throughput and latency for your inserts, and don’t waste unnecessary time on flushing batches which are too large.
We’ve gotten pretty far using some simple application-side changes for data inserts. And while batch inserts will always get you more throughput, there are a lot of additional unintuitive ways to improve the behavior of writes in some scenarios, like:
- Inserting into multiple tables in the same transaction
- Issues with writes on tables with foreign keys (and the source of the
multixacterror from above) - Using
UNNESTinstead of batched inserts - Using unlogged tables
- Upserting data with potential conflicts
Stay tuned for part 2 where we’ll dig into each of these scenarios!